Blog post -
2020 Foresight: The rise of Megadata
If the 2010s were the decade of cloud computing and big data, the 2020s will see a torrential downpour. Already more than 20 billion IoT devices are contributing data. Smart cities will add to that, as will Enterprise Content Management and Machine Learning. These will threaten to drown business leaders that have to derive insights and plan strategies based on veritable oceans of data.
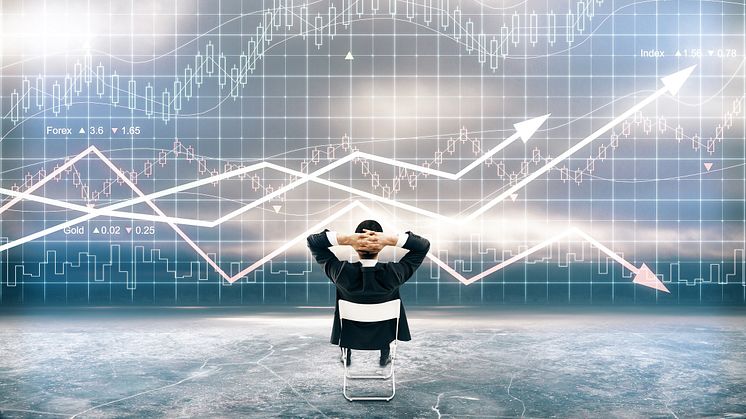
Big data is worth little if you can’t derive business outcomes from it. Therefore, how that data is presented also has to evolve. Analysis automation, conversational analysis and augmented analytics will become essential, but these will not absolve presenters in corporate boardrooms everywhere from making the data more accessible. All too often, data is presented as an end in itself. Presentations featuring charts, graphs, or even live dashboards usually leave open the questions of “So what?" and “Now what?”
In my experience, part of the reason for that is the often-contradictory nature of data. It often doesn’t align. There are always outliers and exceptions to the trend that could make or break the trend.
Take, for example, the discussion around rising methane levels in Barren (now called Utqiagvik) in Alaska. The chart seems to show unequivocally that atmospheric concentrations of this potent greenhouse gas are rising at alarming rates. Commentators are freaking out over the trend:
Much is being made of a graph depicting changes in methane concentrations at Barrow Alaska and a recent supposed spike over the last year.
Let's catch our breath for a moment and put this in proper scientific context.
1/n
(thread) pic.twitter.com/OYsQYCKCwk
— Michael E. Mann (@MichaelEMann) September 14, 2019
But read through the assessments and the picture becomes less clear. When did the trend really start? Is the scale at the left of the graphic implying a doubling of methane levels when actually they are up “just” 15%-20%?
As big data pools coagulate to become megadata (not to be confused with metadata), it will become more and more difficult to read patterns into the picture, to infer conclusions and plan how to respond.
It’s not enough to undergo a PowerPoint course to excel at creating nice-looking slides of charts and graphs. Can you find meaningful patterns that deal with exceptions, false positives and counter-trend data? Are you able to make the data come alive for your audience? Can you communicate inferences from the data, leading to business decisions? Do your audiences leave the room with answers to the two critical questions they all ask. Our data communications workshops ensure megadata actually leads to substantive, well-founded and real business outcomes.
Do you have 2020 Foresight?
The 2020s. If you’re like me, you would have considered this decade to be too far off to contemplate. Long-term government planning reports talked about the 2020s. Authors set their science fiction novels in the 2020s. The 2020s were a mirage.
Yet here we are, just weeks away before we catch up with the future.
In this series I look at five key trends likely to shape the new decade.
- Climate change and the switch to live video and webcasts – But will anyone pay attention
- How to be the best human you can be in an AI world – You can't be anyone you want to be, but you can be the best of who you already are
- Can you prove your CEO didn’t say this? – Deep fakes, guerrilla media, and the blurred lines between fake and real
- The rise of Megadata – If you thought death by PowerPoint was bad now, just wait until you drink from the data hosepipe
- New threats make crises inevitable – Drones, cyberattacks, climate change all make for the crises of the future
Talk to us about how to invest your remaining 2019 training budgets with 2020 foresight.


